The Earth as a continuous system.
Before any site is drawn, the planet is. Volume I opens by placing architecture inside the biosphere described by Vladimir Vernadsky and James Lovelock: a thin, living layer that converts solar energy into chemistry, form and climate, and holds itself steady through feedback.
In this reading a city is not separate from the mine, the field and the river that supply it. The book follows Pope Francis’s Laudato Si’ in treating that dependence as a responsibility: "As the human environment and the natural environment flourish together, the two also deteriorate as one."I, p. 20 It adopts Glen Howard Small’s definition of the megastructure as "a combination of many objects and systems" whose limit case is "the earth as a whole."I, p. 23, 136
The first drawings of the practice are therefore maps. They show where matter goes.
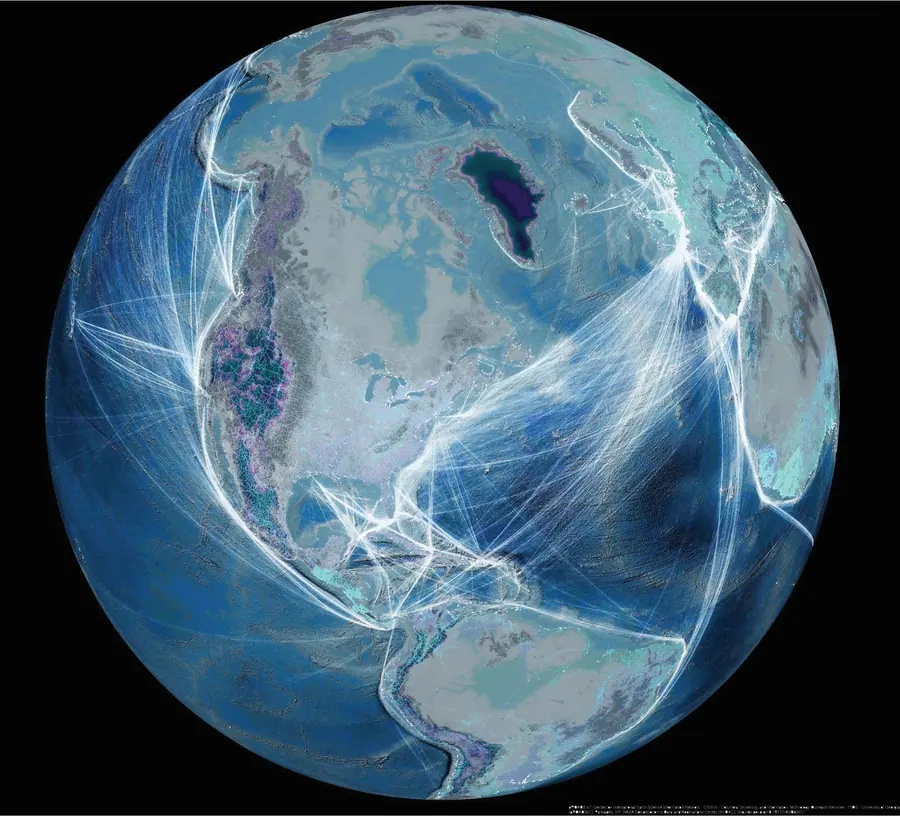
Sea routes appear as white arcs, land routes in red, and the places of consumption in yellow, on a projection centred on the Pacific.I, p. 17–18 The drawing makes a simple point with data: the built environment of one coast is assembled from the geology of another.
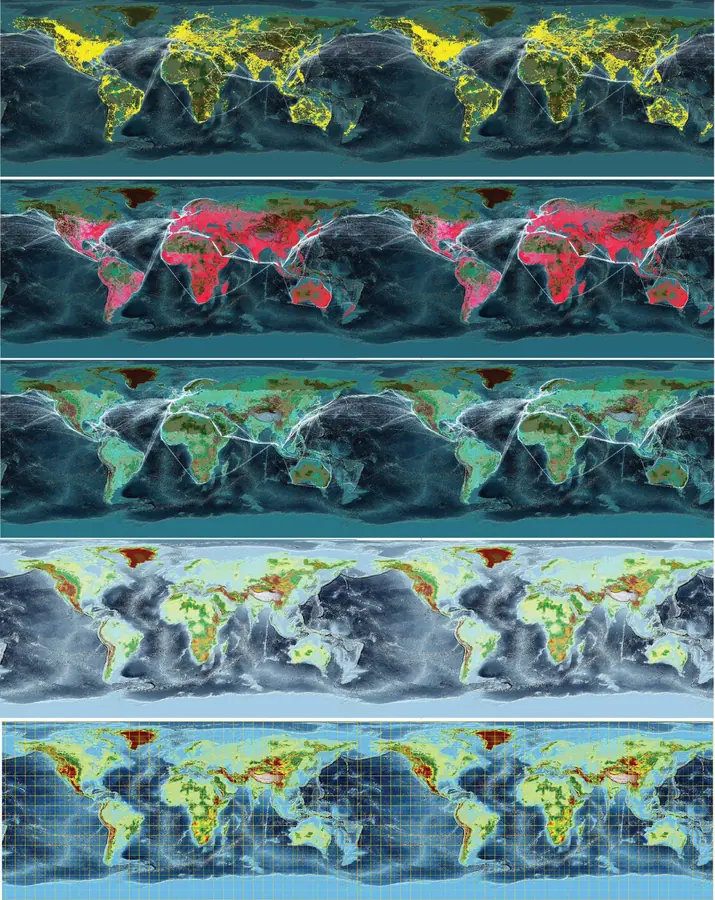
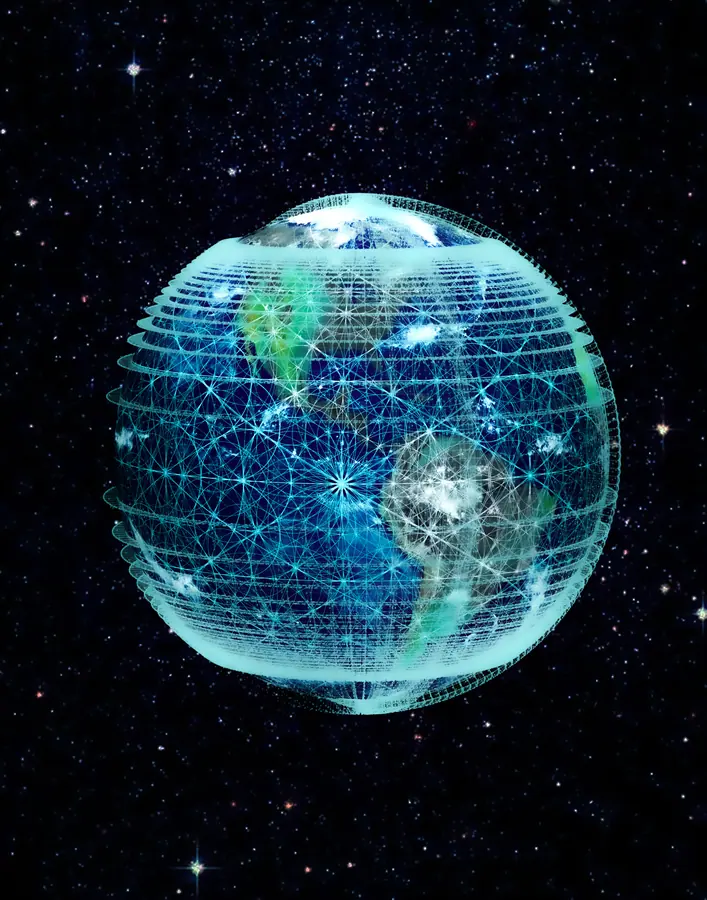
The Earth is a continuous ecology that circumscribes the planet with interdependencies networked in its totality.
Terrestrial Architecture, Vol. I, p. 123
| Layer | What it is | Role in design | Source |
|---|---|---|---|
| Biosphere | The living envelope that transforms cosmic energy (Vernadsky). | The client system. Form is judged by what it does to these cycles. | I, pp. 25–34 |
| Geochemistry | Reversible cycles of elements through rock, water, air and life. | Materials are traced as flows with origins and returns, not as inert stock. | I, pp. 37–43 |
| Gaia | Homeostasis through feedback (Lovelock). | Design is an intervention in a regulating system and must be sensed and corrected. | I, pp. 26, 34 |
| Technosphere | Extraction, logistics and settlement at global scale. | Mapped with the same instruments as the natural layers, on the same base. | I, pp. 17–23, 121–123 |
Cyberinfrastructure is how the planet is seen.
Part 2 of Volume I surveys the instruments that make planetary design possible: photogrammetry, digital elevation models, lidar, multispectral satellite imagery, and the institutions that hold the archive, NASA’s Earth Observing System and its data system, the U.S. Geological Survey, and the Open Geospatial Consortium’s standards for sharing it.I, p. 91–101
The book uses the nervous system as its analogy. Sensors are nerve endings; data centres are memory; models are where signals become anticipation.I, p. 85–88 The platforms that manage this data are described as "the pinnacle project of cyberinfrastructure", because without them the Earth cannot be read as a whole.
Two consequences follow for the practice. First, every project starts from measured terrain, land cover, hydrology and climate. Second, the places where that data is kept and interpreted are themselves an architectural programme, taken up in the instrument buildings.
- AcquireSatellites, aircraft, drones, land-based sensors and vehicles.
- CatalogueTaxonomies after the USGS: biology and ecosystems, water, minerals, resource extraction, geology, energy.
- GeoreferenceEvery dataset tied to one coordinate system and elevation datum.
- ModelNested models from parcel to basin to globe.
- PublishShared services so that communities and disciplines read the same model.
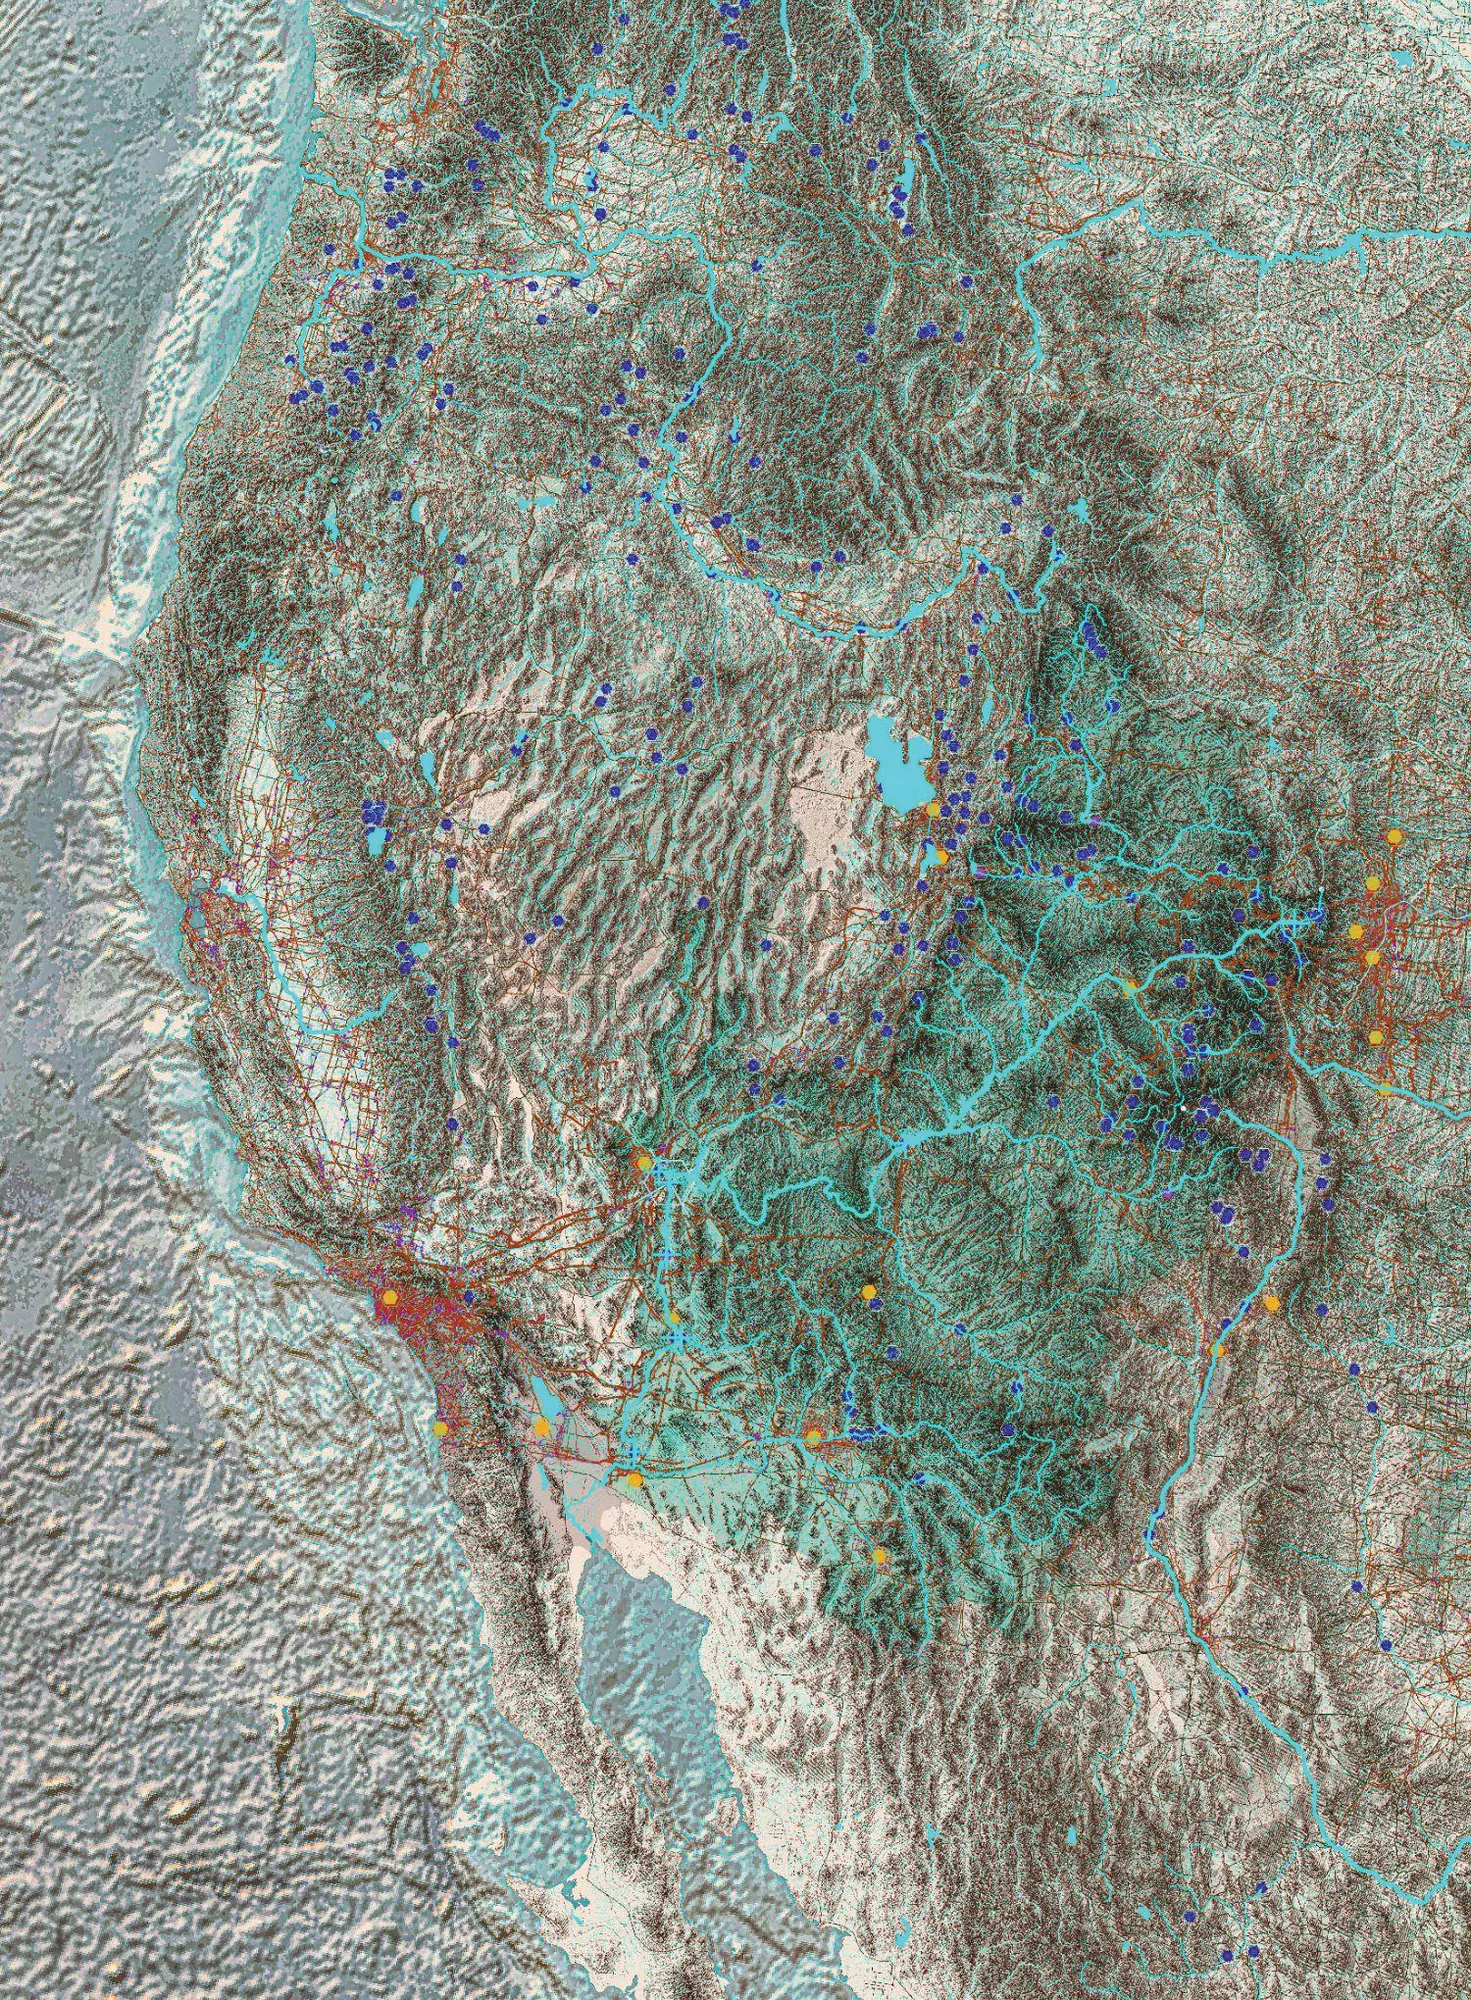
The watershed is the site.
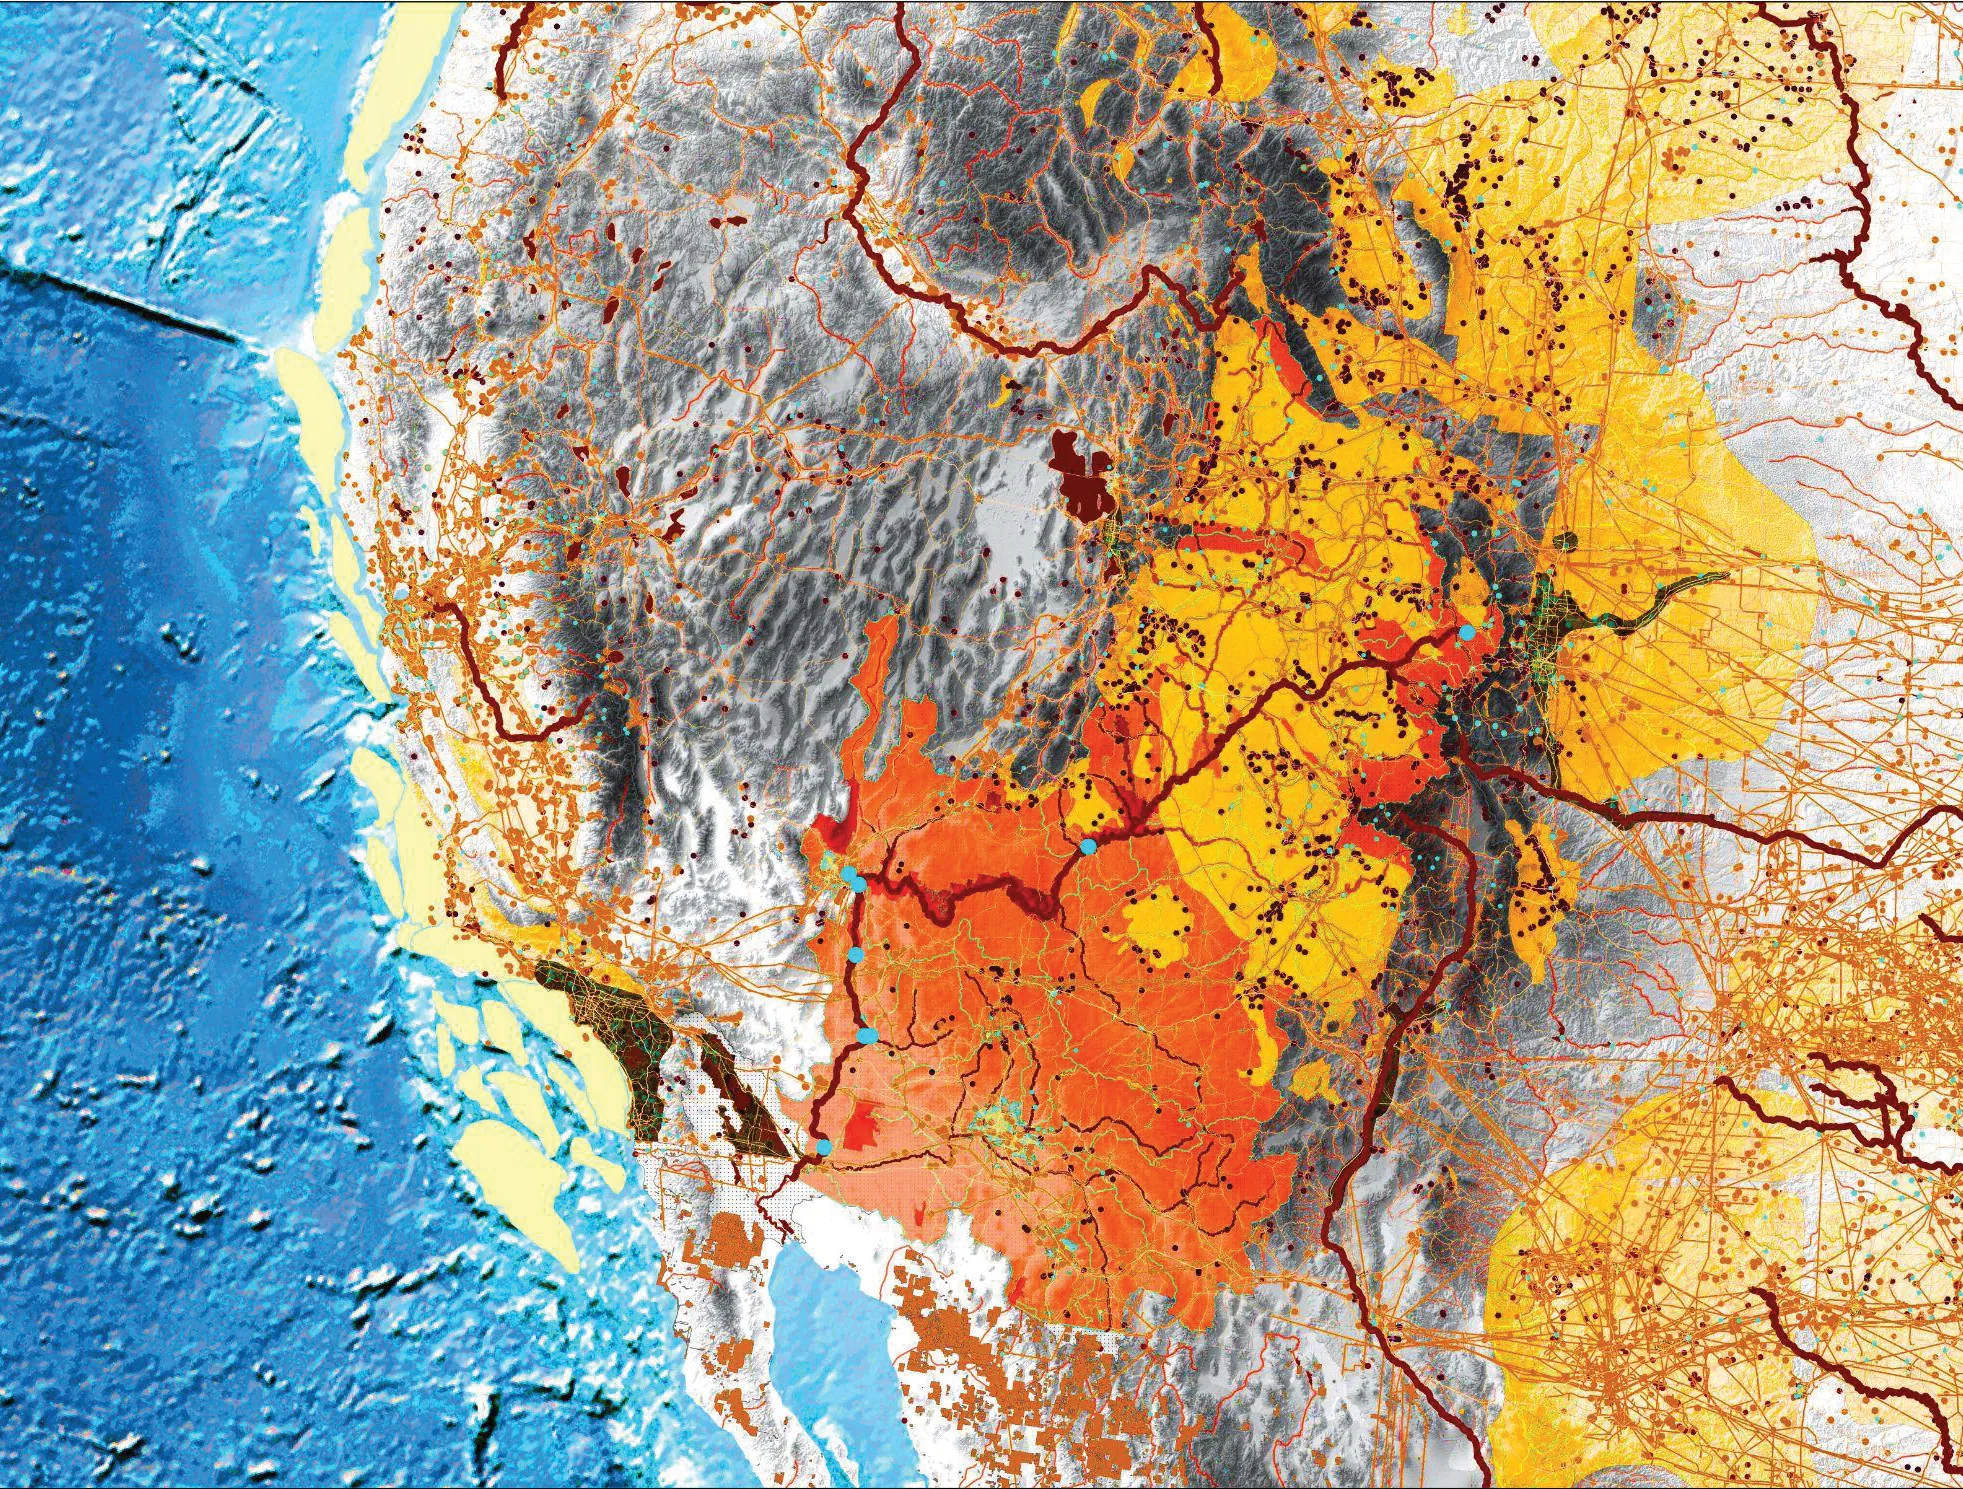
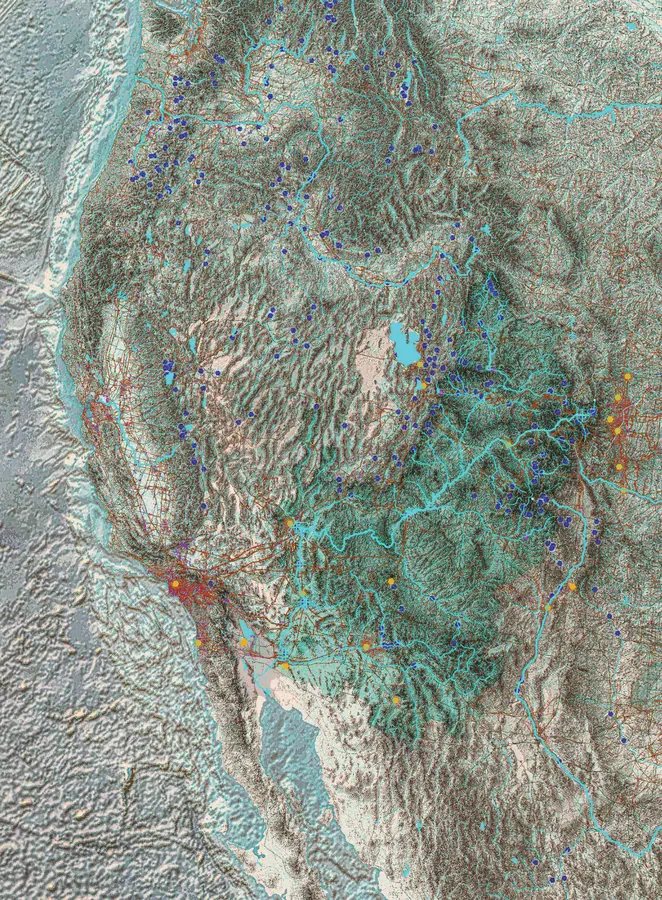
Colorado River Basin, terrain
Lauren Bon and Metabolic Studio · Vol. I, p. 125
Case study: the Colorado River Basin.
The watershed is the first unit of territorial design: a region defined by where water goes, not by where jurisdiction stops.
The Colorado River Basin study and the global trade cartography were produced at Metabolic Studio under the direction of Lauren Bon, during Jack Oliva-Rendler’s time working at the studio. The research belongs to that collaboration and is credited to Lauren Bon and Metabolic Studio. It is shown here as published in Terrestrial Architecture, Volume I, Chapter 9.
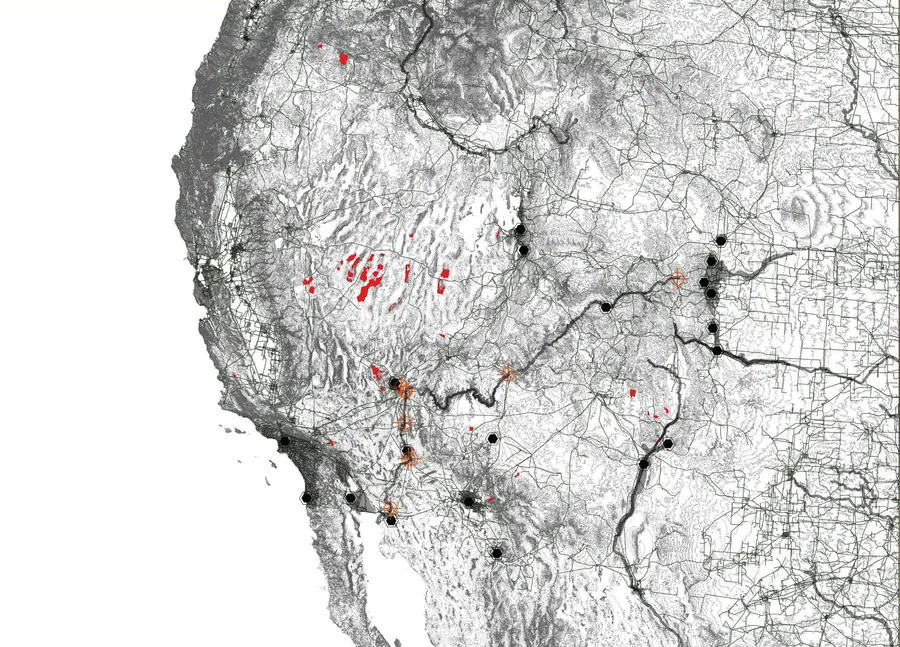
Chapter 9 of Volume I presents the Colorado River Basin study, made at Metabolic Studio with Lauren Bon. The basin is read as a single machine of extraction, distribution and consumption, in which dams, canals, farms and cities far outside the catchment are one connected artefact.I, p. 121–127 The figures below are those given in the book.
- Area
- 250,000 square miles
- People supplied
- 40 million
- Irrigated land
- 5 million acres
- Hydropower
- 780,000 homes; 1.3 million people
- Imperial Valley
- 460,000 acres under cultivation
- Salton Sea lithium
- 32 million metric tons
- Los Angeles demand
- 524 million gallons per day
- Credit
- Lauren Bon and Metabolic Studio
- Source
- Vol. I, p. 124
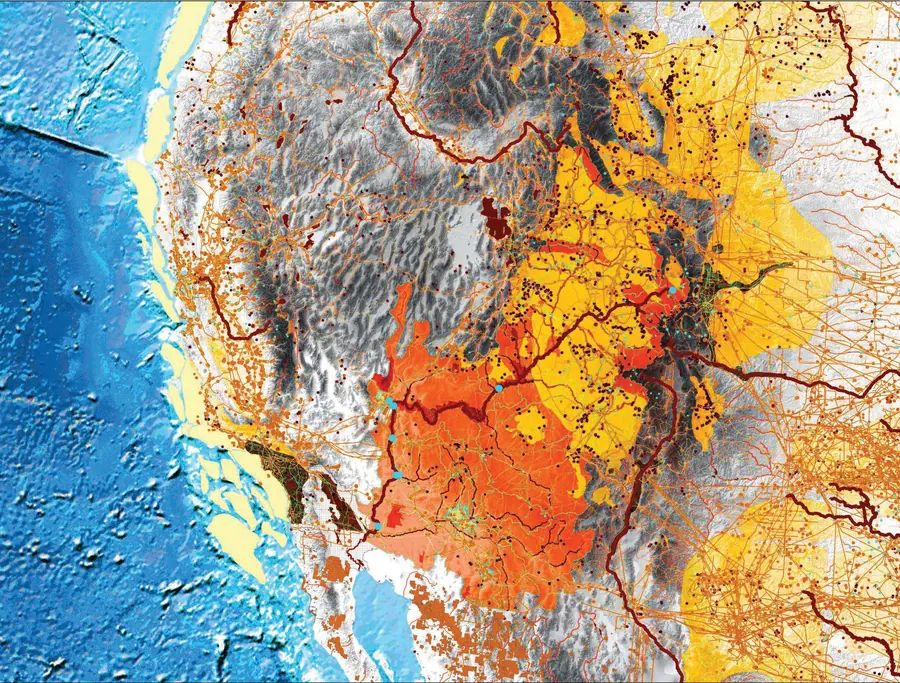
The maps layer relief, river network, reservoirs, diversions and the cities and fields at the receiving end. Read together they show a basin whose water is committed several times over, and whose form, the pattern of terraces, canals and settlement, is the physical record of those commitments.
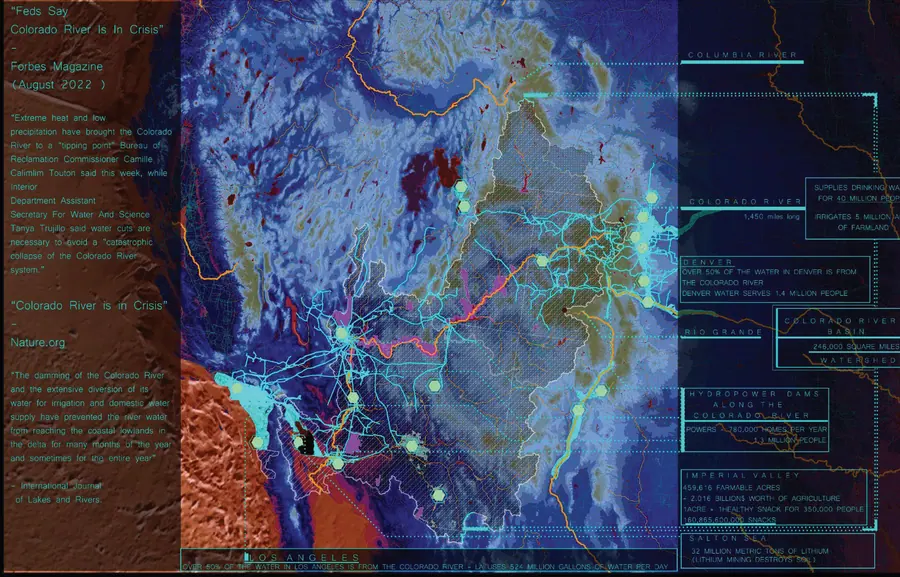
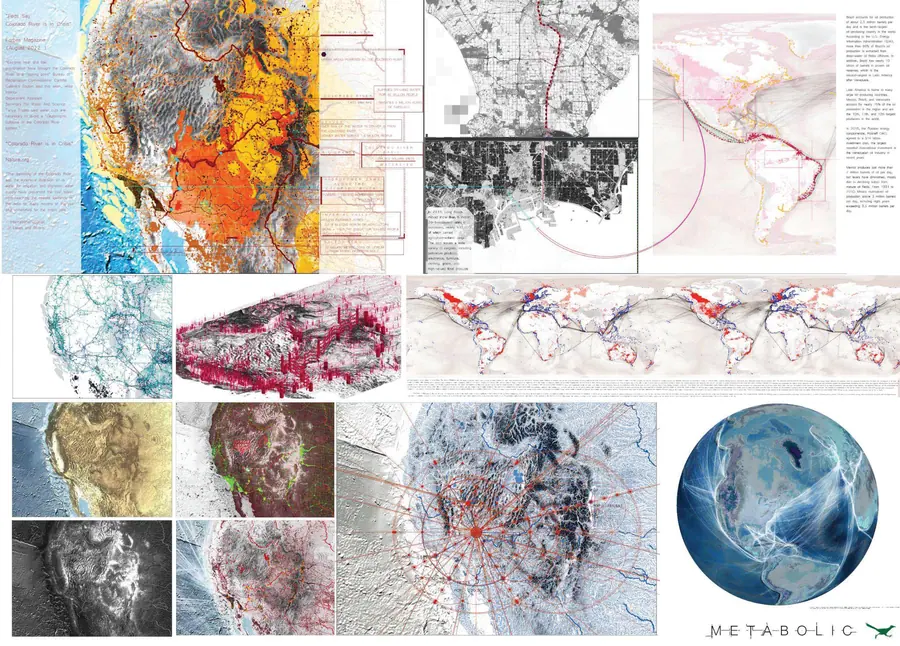
The chapter closes by calling for multi-scale nested models that add up to "a digital twin of the planet":I, p. 127 a basin model that contains city models, which contain buildings, each exchanging data with the levels above and below.
The crust is a continuous membrane, in some areas submerged under oceans and in some areas rising above clouds.
Terrestrial Architecture, Vol. I, p. 123
Platform architectures and community action.
A platform, in Volume I, is "an interface or a managerial device that allows for the composition and decomposition of data."I, p. 103 Chapter 8 proposes an open object model in which every element of a city, parcel, building, street, tree, pipe, carries layered ecological attributes, and a process for using it with the people who live there: Virtual Community Action Planning.
VCAP is described as "a dynamic and innovative process that combines the deconstruction of a city with the integration of the Digital Gaia API."I, p. 106 It is set out as an eight-week curriculum followed by an implementation phase, with Watts Rising in Los Angeles as its case, and a seven-step design workflow that ends in a digital twin.I, p. 106–119
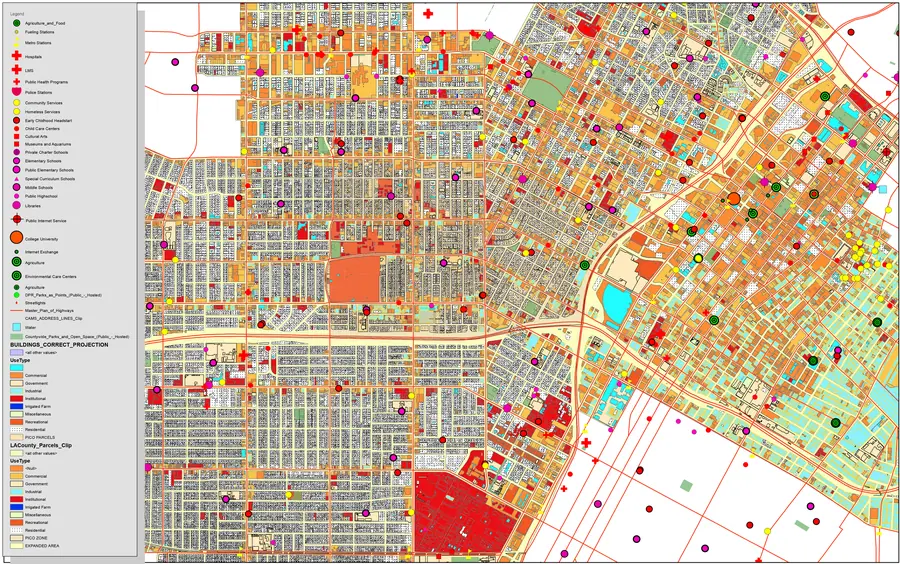
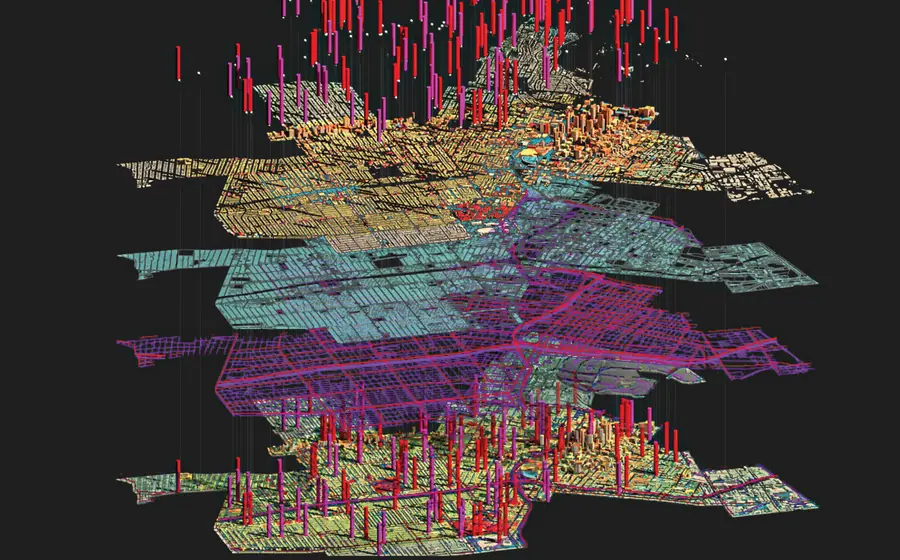
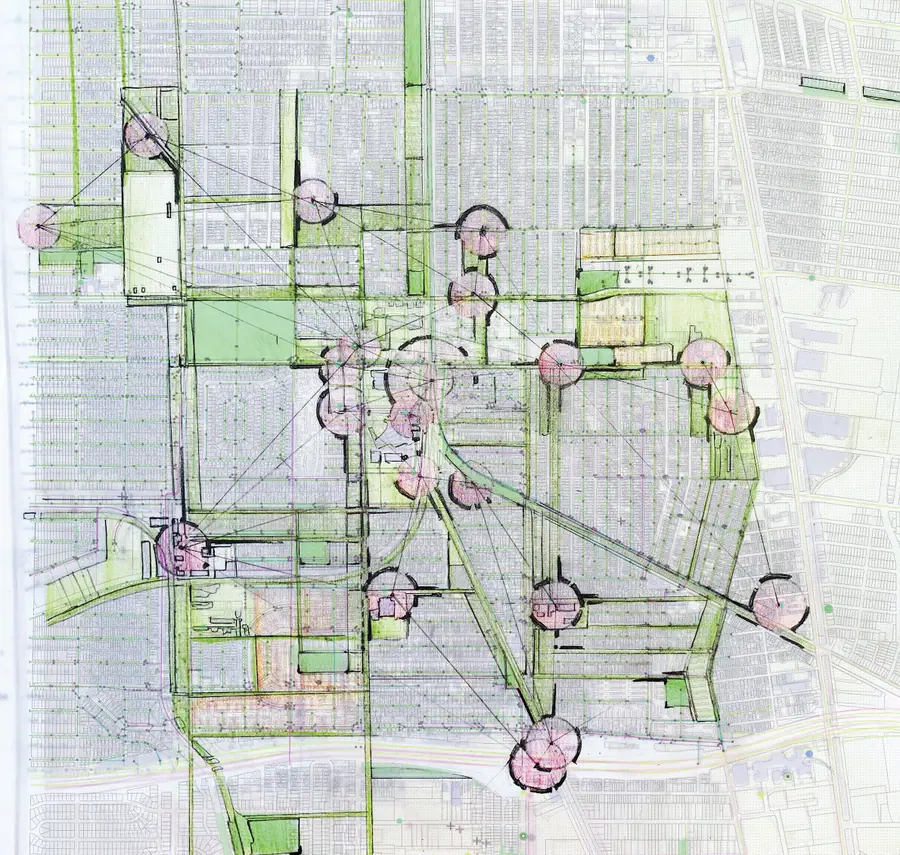
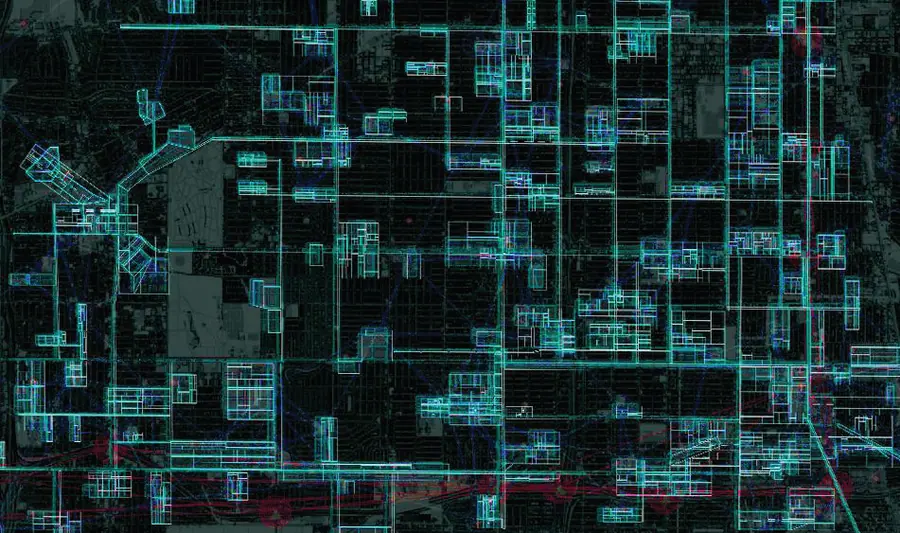
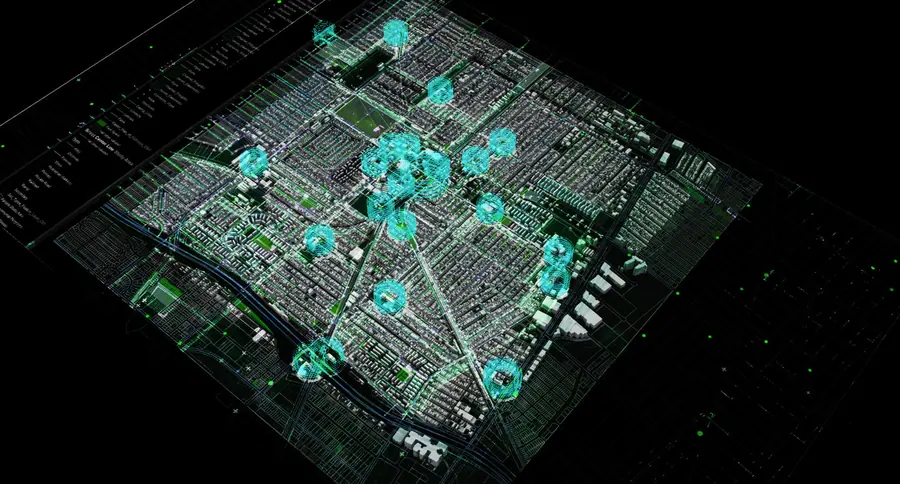
| Layer | Content | Question it answers |
|---|---|---|
| Land | Parcels, ownership, zoning, soil, slope | What is permitted, and what is the ground? |
| Nature | Canopy, habitat, water, heat | What is alive here and how is it stressed? |
| Cultural activity | Institutions, programmes, gathering places | Who acts here? |
| Systems | Energy, mobility, water, waste | What flows through? |
| Projects | Planned and proposed interventions | What is already changing? |
| Platform | The shared model and its interface | How do residents and professionals read it together? |
The six layers above paraphrase the platform’s categories as listed in the book.I, p. 118 The meeting between residents, professionals and the model is what the book calls instrumentalization.
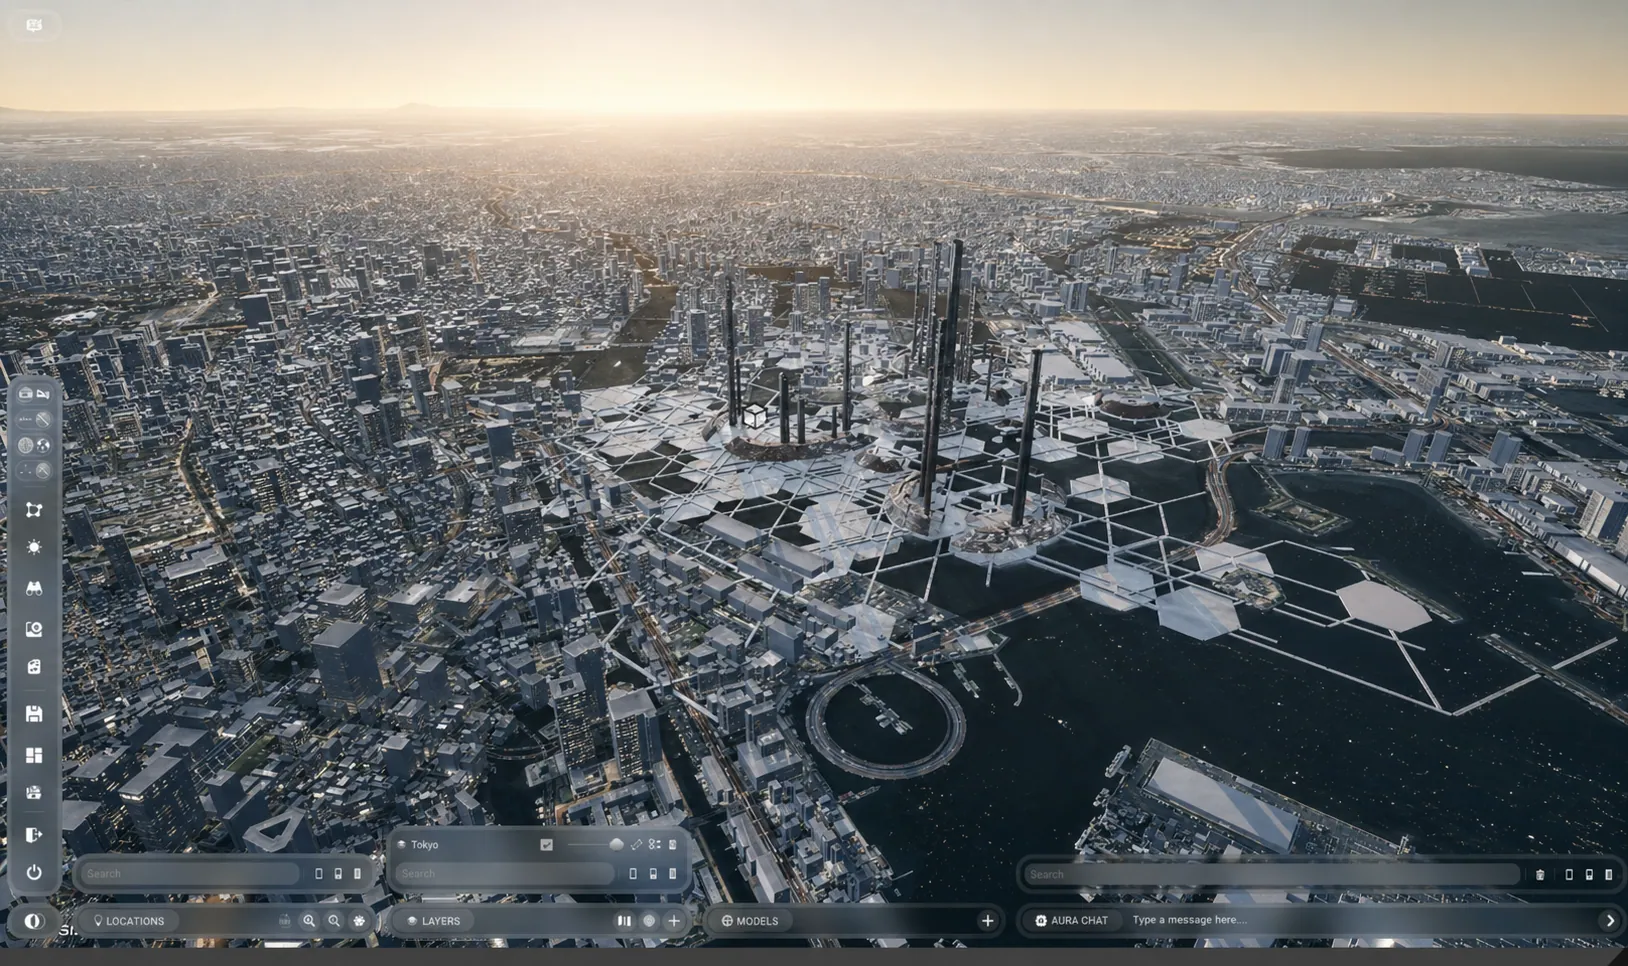
The model is the working ground.
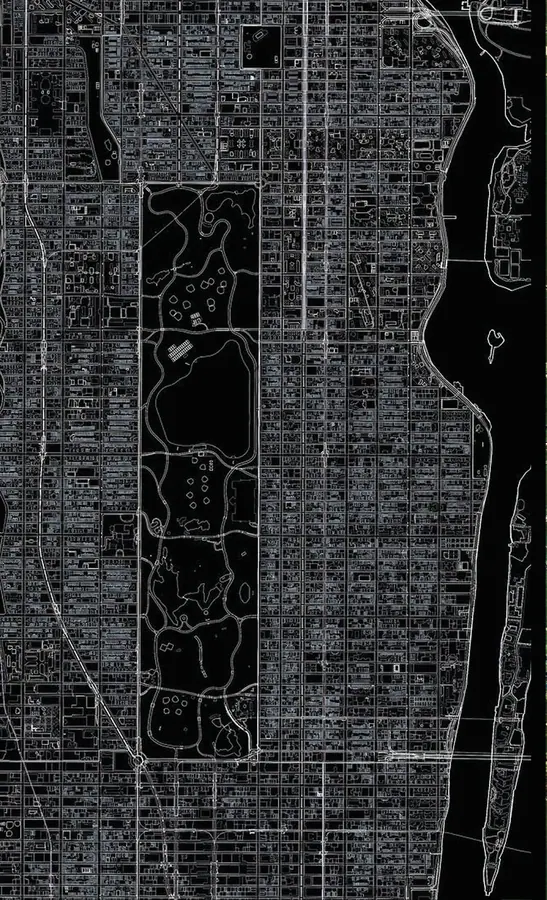
AURA, Tokyo
AURA platform · Vol. II, ch. 17
AURA: the model as working environment.
Volume II, Chapter 17 documents AURA, "a geospatial and extended reality (XR) platform"II, p. 161 in which the principles of the books are applied to live geographic data. The chapter describes it as a tool for distinguishing harmonic from dysfunctional patterns in the built environment and for testing interventions at several scales.
Capabilities named in the chapter:
- Conversational spatial query over a city model
- Regulation-aware reasoning about parcels and zoning
- Semantic parsing of documents and their placement in space
- Pixel-level interpretation of raster layers such as heat, slope and solar exposure
- Correlation across layers through a spatial-semantic graph
- A hybrid AI system combining local and cloud language models
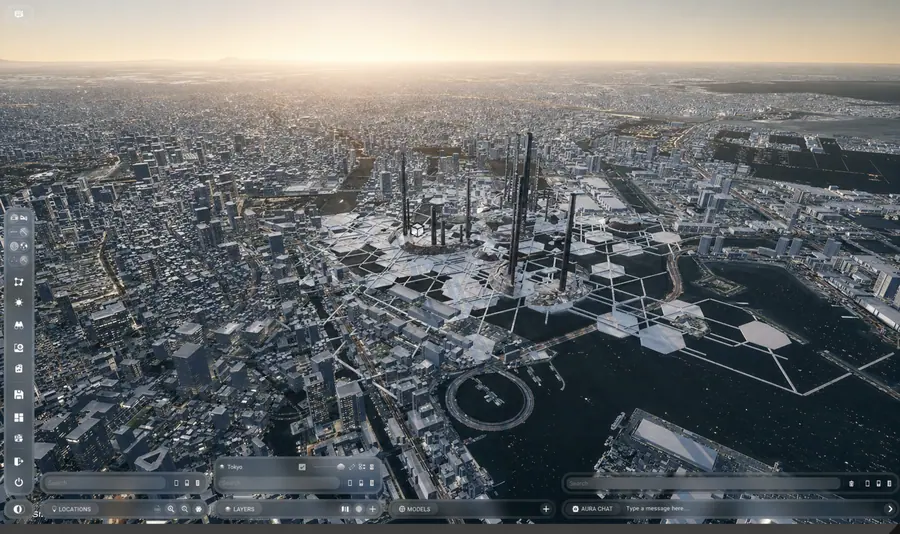
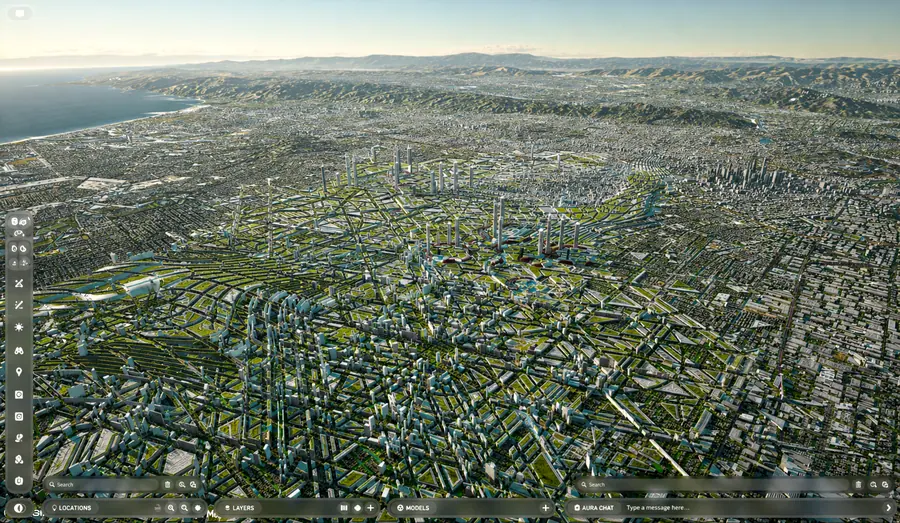
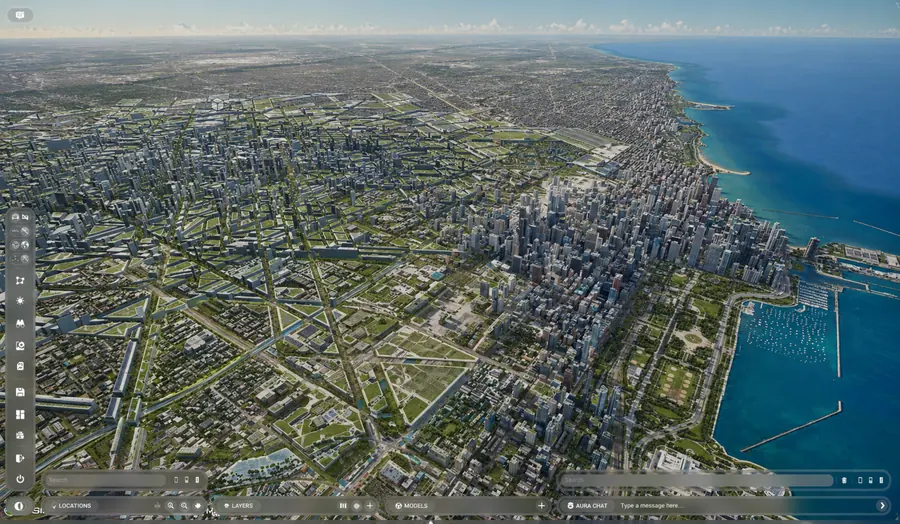
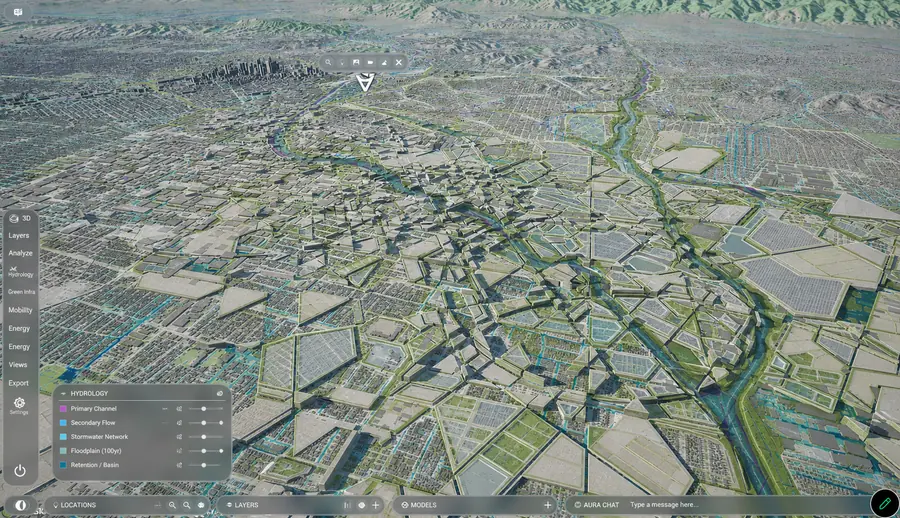
The chapter lists climate resilience, biodiversity, energy transition, education and global cooperation as future directions.II, p. 164
Build with nature’s geometries, not against them.
Vol. II: The Codex, p. 164
The planetary grid and the Codex Swarm.
Volume II makes two further proposals at territorial scale. The first is a model: the Earth treated as a spherical standing-wave system, described with spherical harmonics and great-circle sinusoids, whose nodes the book associates with historically significant sites.II, p. 77–80 This is the Planetary Tensor Grid. It is presented in the book as a mathematical and philosophical framework, not as measured geophysics.
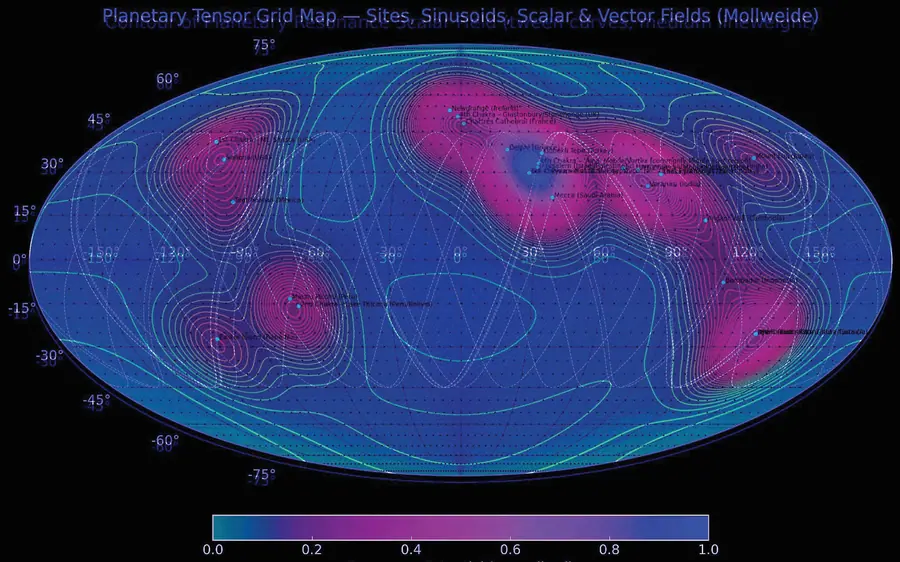
The second is operational. Chapter 23 proposes the Codex Swarm, "a constellation of specialized autonomous agents"II, p. 196 for ecological restoration, with separate agents for water, soil, vegetation, fire, wildlife corridors and human constraints, coordinated by a rule the book calls tuning. It is a proposal, not a deployed system.
- SenseRead the condition of land and water.
- DiagnoseLocate where cycles are broken.
- ProposeGenerate candidate interventions.
- SimulateTest them in the model.
- ExecuteDistributed action on the ground.
- VerifyMeasure, and return to sensing.
A dwelling becomes a hydrological device. A street becomes a water-slowing contour. A city becomes a mosaic of micro-ecologies.
Vol. II: The Codex, p. 198
"The Earth does not need saving by intelligence. It needs intelligence capable of listening."II, p. 198